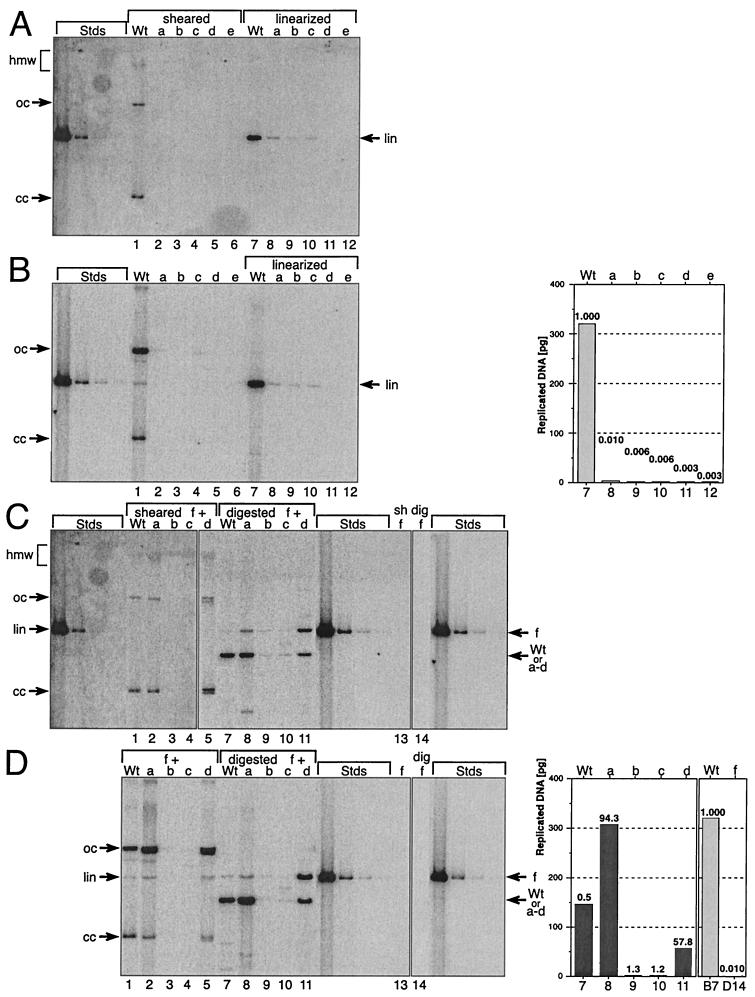
FIG. 6.
Stable replication of HPV31 genomes containing mutant E6 splice sites. Shown is the stable replication of wt and mutant HPV31 genomes: Wt, wt HPV31; a, pHPV31-E6SD; b, pHPV31-E6SA; c, pHPV31-E6SR2; d, pHPV31-E6ID; e, pHPV31-E6IS. Primary HFK were stably transfected with individual viral DNAs (A and B) or paired DNAs (C and D), where the wt and mutants a through e were each cotransfected with mutant f (pHPV31-E7NS). Each autoradiogram contains HPV31 standards (Stds): 500, 25, 2.5, and 0.5 pg of linearized DNA (7,912 bp). Aliquots (5 μg) of total cellular DNA were analyzed in panels A and C; therefore, the DNA standards represent about 100, 5, 0.25, and 0.1 viral genomes per cell, respectively. Arrows, migration of the different topological forms of the viral DNA. A high-molecular-weight (hmw) smear indicates that the HPV DNA is either integrated into the cellular genome or replicates as a plasmid multimer. The covalently closed (cc) and open (oc) formsof HPV DNA result from autonomously replicating plasmid monomers. Linearized (lin) HPV DNA bands were used to quantify the replicated viral DNA. (A) Autoradiogram from transfections with individual HPV31 genomes (wt and mutants a through e). DpnI-resistant, sheared-total-DNA samples are shown on the left (lanes 1 to 6), and the linearized ones are shown on the right (lanes 7 to 12). (B) Autoradiogram showing low-molecular-weight (Hirt) DNA isolated and analyzed from the same cell lines as in panel A. DpnI-resistant samples are shown on the left (lanes 1 to 6), and linearized ones are shown on the right (lanes 7 to 12). The linearized sample bands were quantified and graphed. The value labels indicate the relative replication levels of mutants versus wt. (C) Autoradiogram from transfections with paired HPV31 genomes (wt and mutants a through d, each paired with f). Lanes 1 to 5, DpnI-resistant-, sheared-total-DNA samples; lanes 7 to 12, digested-DNA samples; lanes 13 (sheared) and 14 (digested), stable replication of pHPV31-E7NS (f) by itself. Arrows, positions of pHPV31-E7NS (f) and the cotransfected DNA (wt and a to d). (D) Autoradiogram showing low-molecular-weight (Hirt) DNA isolated and analyzed from the same cell lines as in panel C. DpnI-resistant samples (left; lanes 1 to 5) and digested ones (middle; lanes 7 to 11) are shown. Lanes 13 and 14, stable replication of pHPV31-E7NS (f) by itself (digested). Arrows, positions of pHPV31-E7NS (f) and cotransfected DNA (wt and a to d). The digested lower sample bands (wt, a to d) were quantified and graphed (right). The value labels show the relative increases of stable replication levels of the sample DNAs with pHPV31-E7NS (f) compared to the autonomous levels (panel B). The replication of wt (panel B, lane 7) and pHPV31-E7NS (panel D, lane 14) in single DNA transfections are compared (far right). The value labels in graphs 7 and 14 indicate the relative replication levels of pHPV31-E7NS versus wt.

