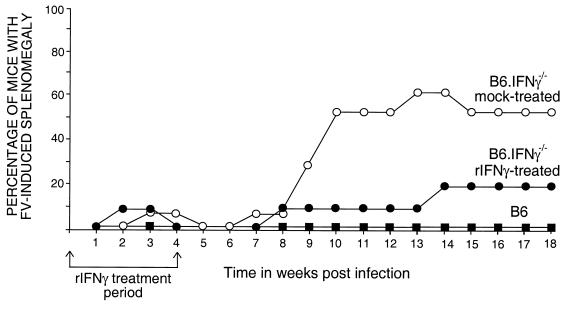
FIG. 6.
Splenomegaly in FV-infected mice. Mice were infected with FV and monitored for induction and progression of splenomegaly as previously described (23). The arrows indicate the period of treatment by i.p. injection with either 105 U of rIFN-γ (•) or saline (○). The numbers of mice in each group were as follows: B6 mice (▪), n = 6; rIFN-γ-treated B6.IFN-γ−/− mice, n = 10; and saline-treated B6.IFN-γ−/− mice, n = 8. The numbers of splenomegalic mice in the treated versus untreated groups were significantly different between 10 and 14 weeks postinfection (all P of ≤0.0405 by Fisher's exact test). The log10 geometric means of the infectious centers per spleen between 16 to 18 weeks postinfection were as follows: B6 mice, 4.08; rIFN-γ-treated B6.IFN-γ−/− mice, 5.23; and saline-treated B6.IFN-γ−/− mice, 5.98.

