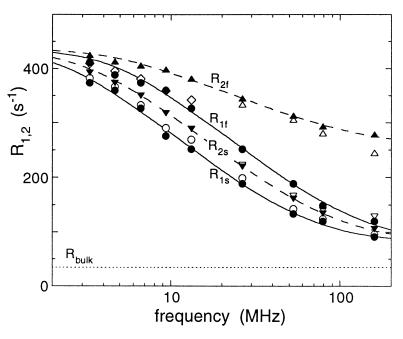
Figure 2.
Result of the global fit of 13 SDF values J(νi) to the 23Na relaxation data from the same sample as in Fig. 1 plotted as fast and slow longitudinal (R1f and R1s, ●) and transverse (R2f and R2s, ▴) relaxation rates. The estimated error bars are of the same size as the data symbols. For comparison, relaxation rates from single-frequency fits are also shown (without error bars) as open symbols: R1eff (○), R2eff (⋄, at lower fields), and R2f and R2s (▵, at higher fields). The curves are based on an assumed form of the SDF.

