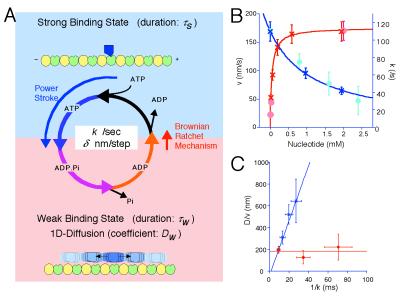
Figure 6.
Brownian motor model and the ATPase perturbation experiments. (A) Summary of the Brownian motor model. Refer to text for details. (B and C) ATPase perturbation experiments. (B) Mean velocity (○) and ATPase turnover rate (×) plotted against nucleotide concentration. For the limiting ATP conditions (red), the concentration of ATP was maintained by the ATP regenerating system (23). For the ADP-addition experiment (blue), ADP was simply added to the buffer containing 2 mM ATP. (C) D/v plotted against 1/k. In the limiting ATP conditions (red), D/v was almost constant (about 190 nm). In the ADP-addition experiment (blue), D/v increase linearly against 1/k. The blue line is the theoretical prediction: D/v = 25(1/k − 1.5).

