
Figure 4.
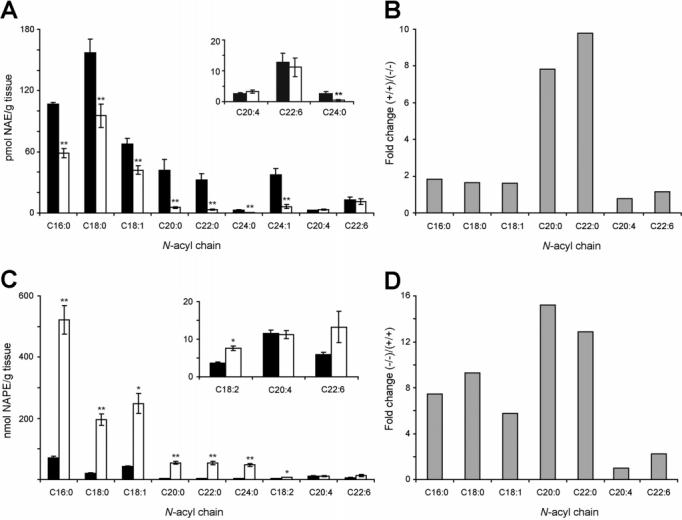
Brain levels of NAEs and NAPEs in NAPE-PLD(+/+) and -(-/-) mice. (A and C) Brain NAE (A) and NAPE (C) levels from NAPE-PLD(+/+) (black bar) and -(-/-) (white bar) mice. Insets: Levels of representative low-abundance NAEs and NAPEs. (B and D) Average fold-change in brain levels of representative NAEs (B) and NAPEs (D) in NAPE-PLD(+/+) and -(-/-) mice. **p < 0.01 for NAPE-PLD(-/-) versus -(+/+) tissues (planned comparison). The results are presented as means (standard error (SE). n) 5-6 mice/group.