
Figure 4.
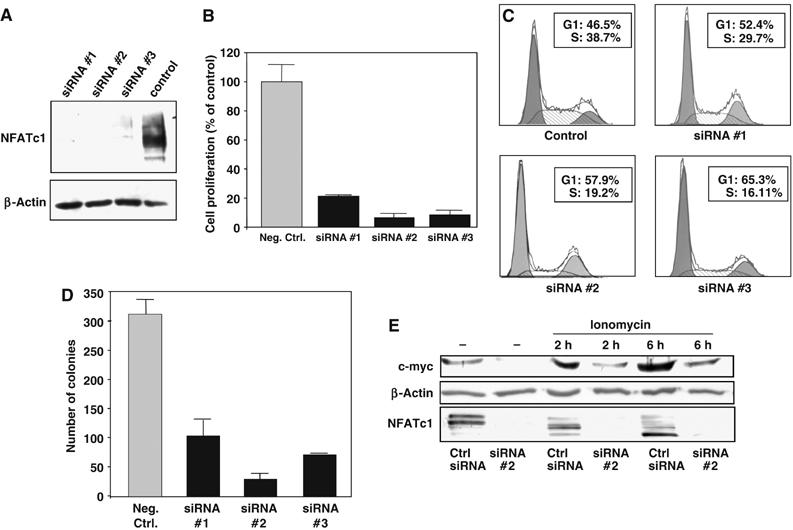
Anchorage-dependent and -independent cell growth and c-myc activation in Ca2+/calcineurin-responsive cell lines is NFATc1-dependent. (A) Western blot analysis of NFATc1 knock down in Panc-1 cells. Cells were transiently transfected with three different NFATc1-specific siRNA sequences or a nonsilencing control siRNA and total cell lysates analyzed 48 h post-transfection using an anti-NFATc1 antibody. (B) Proliferation assays demonstrating dramatically reduced growth of Panc-1 cells after siRNA-mediated knock down of NFATc1. Proliferation was measured by [3H]thymidine incorporation assay. Data are representative of triplicate experiments and are displayed as bars+s.d. (C) Cell cycle analysis of NFATc1 knock-down cells. Cells were transiently transfected with NFATc1-specific siRNA sequences or nonsilencing control siRNA and analyzed 24 h post-transfection by propidium iodide staining and flow cytometry. The percentages of cells in the G1 and S phases, respectively, are indicated. NFATc1 knock down resulted in cell cycle arrest, as indicated by the shift from the S to the G1 phases. (D) Soft agar assays demonstrating significantly impaired anchorage-independent growth of NFATc1 knock-down cells. NFATc1 knock-down and control cells were seeded in soft agar 24 h post-transfection and the number of viable colonies was determined after 10 days. Data are representative of triplicate experiments and are displayed as bars+s.d. (E) Western blot analysis of the effect of NFATc1 knock down on c-myc expression. Panc-1 cells were transiently transfected with the NFATc1-specific siRNA#2 or nonsilencing control siRNA and treated with 1 μM ionomycin for the indicated time periods. NFATc1 and c-myc protein was detected in total cell lysates using specific antibodies. Dephosphorylation, and thus activation, of NFATc1 by ionomycin is evidenced by the shift towards lower molecular weight bands (lower panel).