
Figure 1.
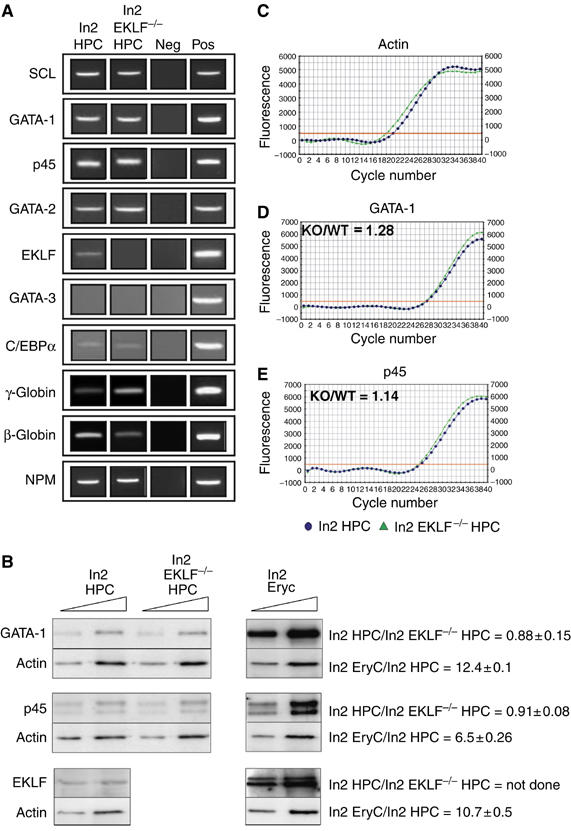
Expression of marker genes in ln2 HPC and ln2 EKLF−/− HPC. (A) Semiquantitative RT–PCR performed on equal amounts of RNA purified from ln2 HPC or ln2 EKLF−/− HPC. PCR samples were resolved onto agarose gel. γ-Globin: fetal human (γ) and mouse embryonic (βH1) transcripts; β-globin: adult human (β and δ) and mouse (βmin and βmaj) globin transcripts; NPM: ubiquitously expressed nucleophosmin transcript, used as internal control; Neg: negative control; Pos: positive control; (B) Western blot analysis of ln2 HPC, ln2 EKLF−/− HPC and ln2 EryC; 4 and 8 μg of whole-cell protein extract were loaded in each lane of a 10% SDS–PAGE. Anti-GATA-1 and -p45 antibodies were purchased from SantaCruz; anti-actin antibodies were purchased from LabVision; anti-EKLF serum is a generous gift of S Philipsen. Protein levels in ln2 HPC versus ln2 EKLF−/− HPC or ln2 EryC versus ln2 HPC were calculated using actin as internal control and they are shown on the right side of each panel together with their standard error of means; (C–E) representative examples of quantitative real-time RT–PCR; the relative level of GATA-1 or p45 gene expression in ln2 EKLF−/− HPC versus ln2 EKLF HPC were calculated according to Pfaffl (2001), using mouse actin as internal control and expressed as KO/WT ratio; x axis: cycle number; y axis: derivative of SYBR Green fluorescence. Blue dots: ln2 HPC; green triangles: ln2 EKLF−/− HPC.