
Figure 4.
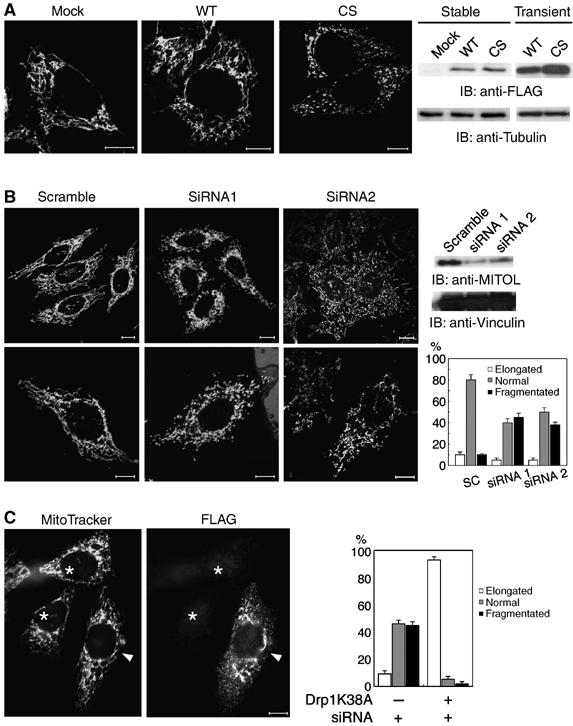
Critical role of MITOL in mitochondrial morphology. (A) Mitochondrial fragmentation in HeLa cell lines stably expressing FLAG-MITOL CS mutant. HeLa cell lines stably expressing control vector, FLAG-MITOL WT or CS mutant were stained with MitoTracker and mitochondrial morphologies were compared. The expression levels of FLAG-MITOL after stable and transient transfection relative to mock-transfected cells were shown by immunoblotting using anti-FLAG antibody (right panel). Bars, 10 μm. (B) Aberrant mitochondrial morphology in MITOL-deficient cells. HeLa cells transfected with scramble, MITOL siRNA1 or siRNA2 were immunoblotted with anti-FLAG and anti-vinculin antibodies (right) or stained with MitoTracker (left). Bars, 10 μm. Percentages of cells showing each mitochondrial morphology were calculated from 100 scramble- or MITOL siRNA-transfected cells. Error bars represent s.d. n=3. (C) Dominant-negative Drp1 mutant blocked mitochondrial fragmentation by MITOL depletion. HeLa cells transfected with FLAG-Drp1 mutant (K38A) and siRNA1 were stained with MitoTracker and anti-FLAG antibody. An arrowhead and asterisks indicate siRNA1-mediated MITOL-depleted cells with or without Drp1 mutant expression, respectively. Bars, 10 μm. Percentages of cells showing each mitochondrial morphology were calculated from 100 MITOL-depleted cells with or without Drp1 mutant expression. Error bars represent s.d. n=3.