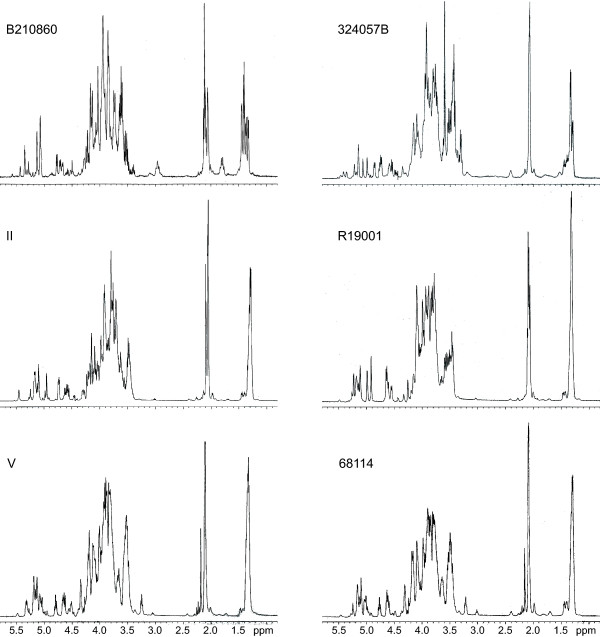
Figure 2.

Proton NMR spectra of the heteroglycan PSs from six enterococcal strains. The different signal patterns indicate different structures. The PSs from strain V and 68114 have very similar spectra. Note that the signals at ~2.1 ppm are due to N- or O-acetyl groups and that the difference in intensity and pattern reveal different acetylation of each PS. Also note that the water signal at 4.45 pm has been suppressed in all spectra.
