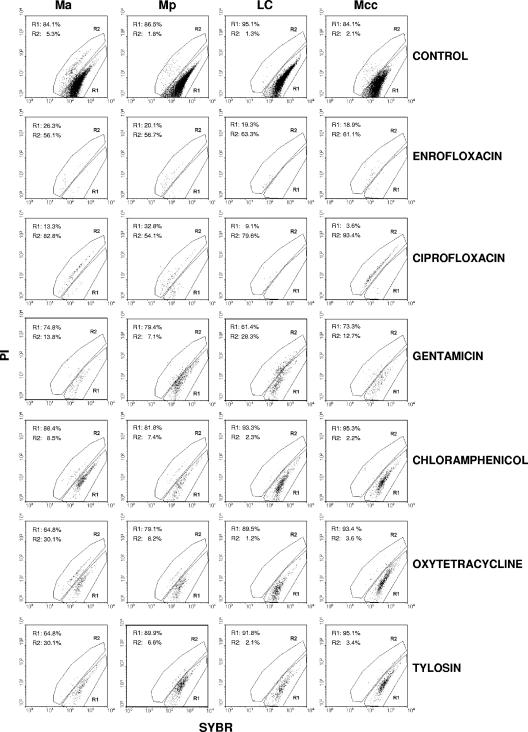
FIG. 4.
Dot plot histograms of the cultures of M. agalactiae (Ma), M. putrefaciens (Mp), M. mycoides subsp. mycoides LC (LC), and M. capricolum subsp. capricolum (Mcc) at 24 h. The results for enrofloxacin, ciprofloxacin, gentamicin, chloramphenicol, oxytetracycline, and tylosin are shown. Region R1 corresponds to live cells, and region R2 corresponds to dead cells. Control, cells without any treatment.

