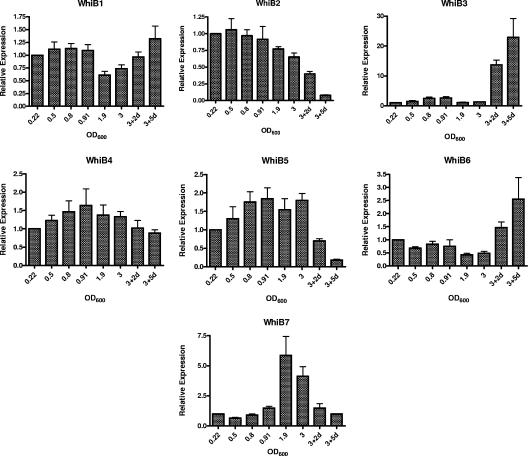
FIG. 1.
Relative expression levels of whiB1 to whiB7 during various phases of growth. Total RNA was isolated from M. tuberculosis (CDC1551) cultures grown to the OD600 values shown. The OD600 values for the respective growth phases are as follows: early exponential (0.22), mid-late exponential (0.8 to 0.91), early stationary (1.9), late stationary (3.0), and very late stationary (2 days or 5 days after OD600 reaches 3.0). Real-time quantitative real-time RT-PCR was performed, and the relative expression level of each whiB was calculated using the sigA transcript for normalization for RNA amounts and the expression level at an OD600 of 0.22 as a control. Data shown are averages from four independent experiments.

