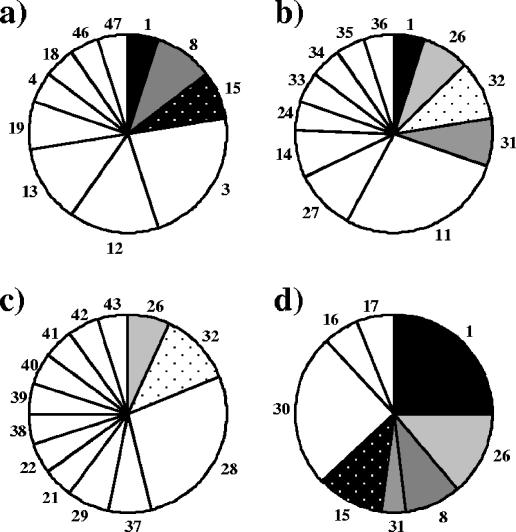
FIG. 6.
Distributions of RFLP pattern types represented by at least two nirS clones in (a) the pilot-scale plant prior to methanol addition (RP2), (b) the methanol-fed pilot-scale plant on day 65 (MP2), (c) the ethanol-fed plant on day 65 (EP2), and (d) the full-scale plant without an external carbon source at the start of the experiment (RF1). White pie slices represent RFLP pattern types specific for the sample, and the numbers refer to the RFLP pattern types.

