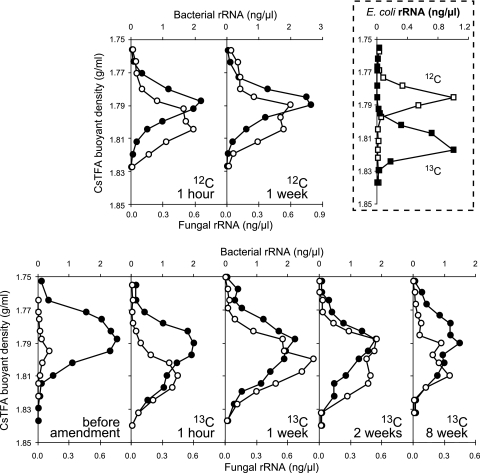
FIG. 1.
Quantitative profiles of RNA-SIP centrifugation gradients. Shown are the distributions of bacterial (solid circles) and fungal (open circles) small-subunit (SSU) rRNA in density gradient fractions of rRNA extracted from soil microcosms incubated with unlabeled (12C, top row) and 13C-labeled E. coli biomass (bottom row) at successive times after amendment as specified. Domain-specific template distribution within gradient fractions was quantified by quantitative reverse-transcription-PCR (13). Dashed box, banding of E. coli pure-culture rRNA in density centrifugation gradients, showing the quantitative distribution of fully 13C-labeled (solid squares) and unlabeled (open squares) E. coli SSU rRNA in separate CsTFA density gradients.

