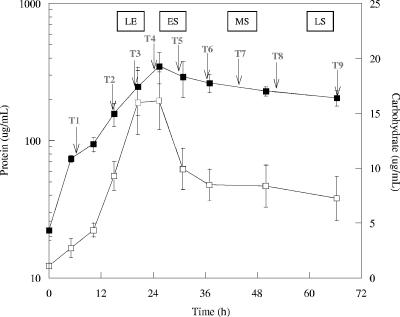
FIG. 1.
Protein ▪ and carbohydrate (□) levels during growth of D. vulgaris cells with lactate and sulfate. The arrows indicate times at which biomass was removed for RNA extraction. The error bars indicate standard deviations. LE, late exponential phase; ES, early stationary phase; MS, mid-stationary phase; LS, late stationary phase.

