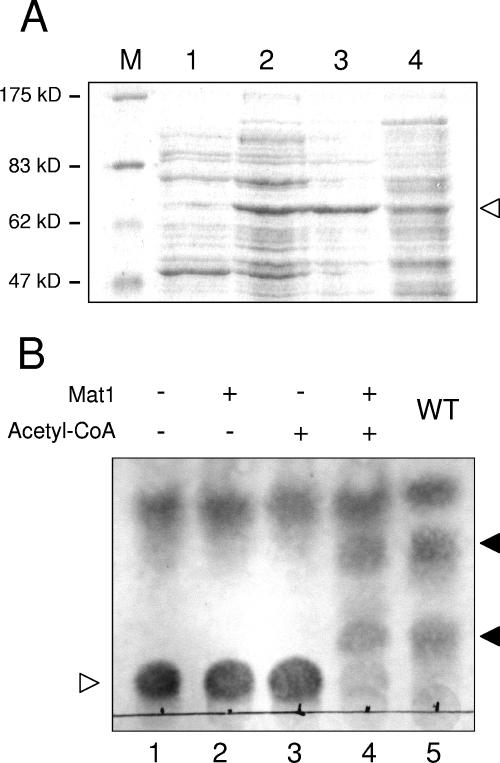
FIG. 5.
In vitro acetyltransferase activity of Mat1. (A) Mat1 was overexpressed in E. coli, and cell extracts were separated by sodium dodecyl sulfate-polyacrylamide gel electrophoresis. The arrowhead indicates the Mat1 protein, which is only partially soluble. M, size marker; lane 1, crude extract from uninduced cells; lane 2, crude extract from induced cells; lane 3, pellet from induced cells; lane 4, supernatant from induced cells. (B) TLC analysis of Mat1 in vitro acetyltransferase activity. Deacetylated MEL D (lane 1) was incubated with Mat1-containing cell extract in the absence of acetyl-CoA (lane 2), with acetyl-CoA and mock cell extract (lane 3), and with both Mat1 and acetyl-CoA (lane 4). For comparison, acetylated MELs (MEL A, MEL B, and MEL C) extracted from a wild-type strain are shown (lane 5). The empty arrowhead indicates deacetylated MEL D, and the filled arrowheads indicate the spots corresponding to partially and fully acetylated MEL variants.

