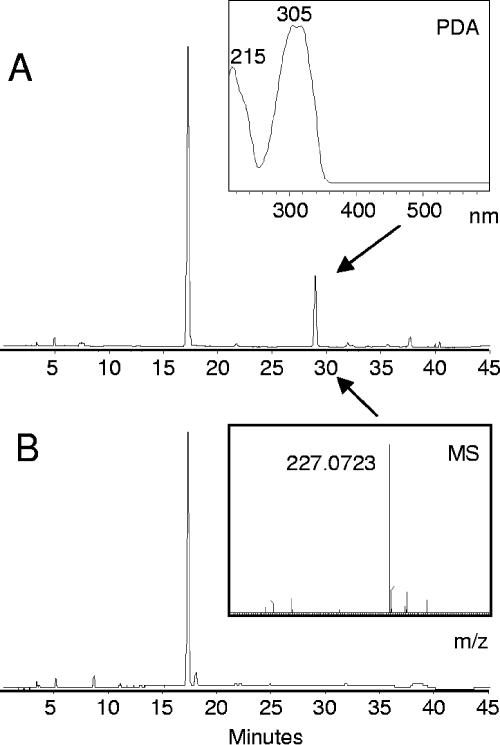
FIG. 2.
HPLC analysis of resveratrol produced by E. coli at 307 nm. The upper chromatogram (A) was derived from an extract of a culture of E. coli BL21 plus pAC-4CL-STS grown with p-coumaric acid for 20 h. Culture medium was separated by an HPLC setup as described in reference 2, and absorbance was recorded at 307 nm. The lower chromatogram (B) shows the same for control E. coli BL21 plus pACYC-DUET1. The peak at 17 min represents p-coumaric acid, and the peak at 28.9 min represents resveratrol. The absorption spectrum of the peak at 28.9 min is shown in the “PDA” inset, while the mass spectrum, recorded with a QTOF ULTIMA mass spectrometer (negative electrospray ionization mode) is shown in the “MS” inset.

