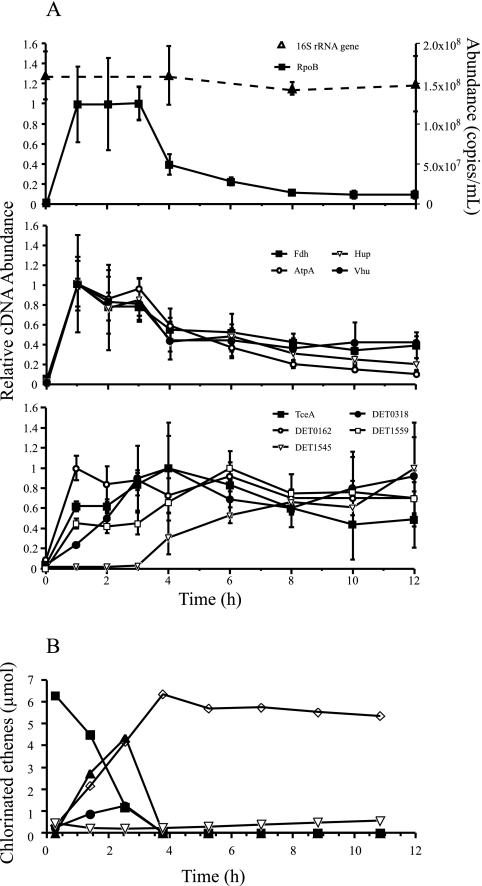
FIG. 3.
(A) 16S rRNA gene abundance (dashed line) and mRNA expression profiles (solid lines) of individual targets over time broken up into functional categories. Error bars represent standard deviations. Each mRNA target is plotted as a fraction of its maximum expression and is represented by its corresponding product. Expression of the RpoB gene, a central metabolic housekeeper, declines after 3 to 4 h, when a majority of respirable substrates are dechlorinated. The Fdh, AtpA, Hup, and Vhu genes are grouped as targets associated with hydrogen metabolism and experience maximum expression within the first 2 hours. RDase genes are grouped together and tend to experience maximum expression after 3 h. (B) Dechlorination profiles in triplicate subculture bottles. PCE (▪), TCE (•), and cDCE (▴) are fully dechlorinated within 4 to 5 h, followed by the slow conversion of VC (⋄) to ethene (▿).

