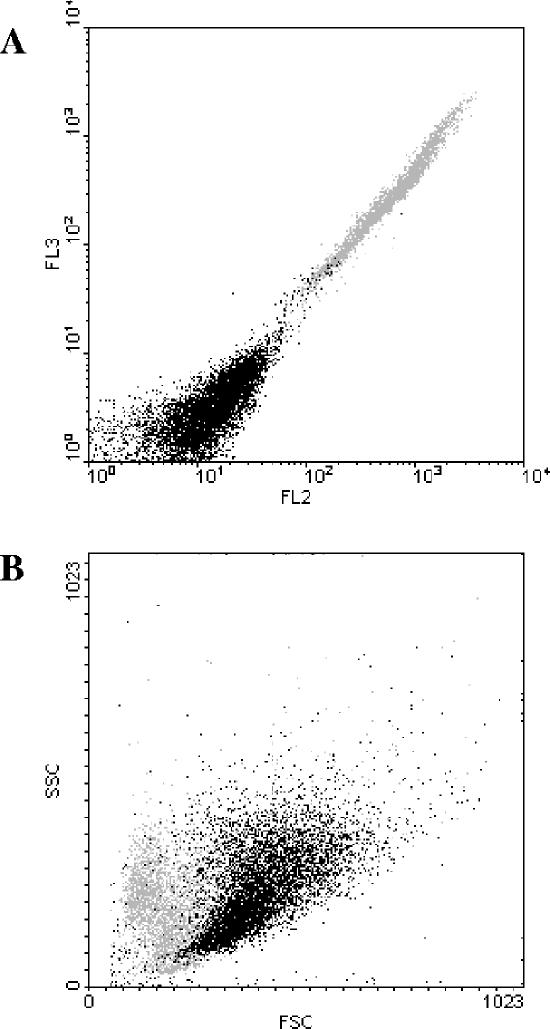
FIG. 3.
Analysis of dead cells. (A) Fluorescence emission of cells of strain CEN.PK RWB876 stained with ethidium bromide (acquisition in logarithmic scale). This dot plot shows the presence of two subpopulations of cells: one with low fluorescence (viable cells) and one with high fluorescence (dead cells). The dead cells are identified with a gray color. (B) FSC and SSC of the same sample. This dot plot shows that the dead cells identified in panel A (gray color) have a reduced volume.

