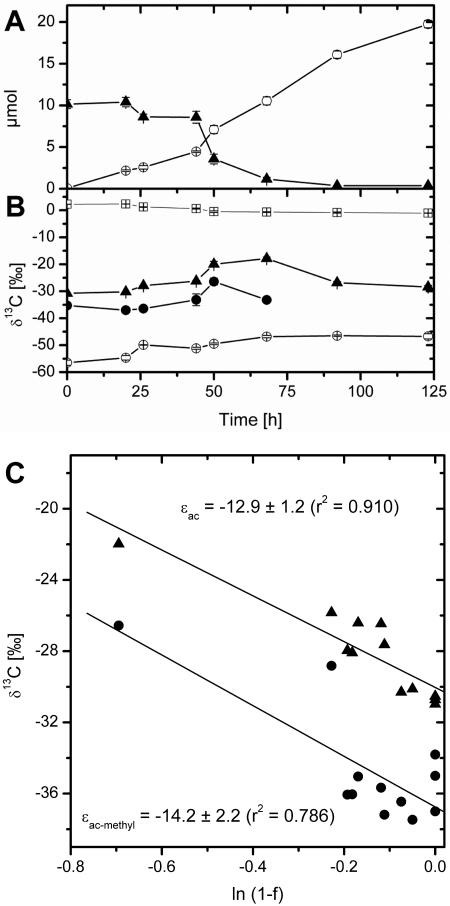
FIG. 3.
Acetate consumption in Lake Dagow sediment (obtained in 2004) amended with acetate. (A) Acetate consumption (▴) and CH4 production (○). (B) Isotope ratios of total ac (▴), ac-methyl (•), CO2 (□), and CH4 (○). (C) The plots are based on equations derived by Mariotti et al. (11). The values in panels A and B are means ± standard errors (n = 3).

