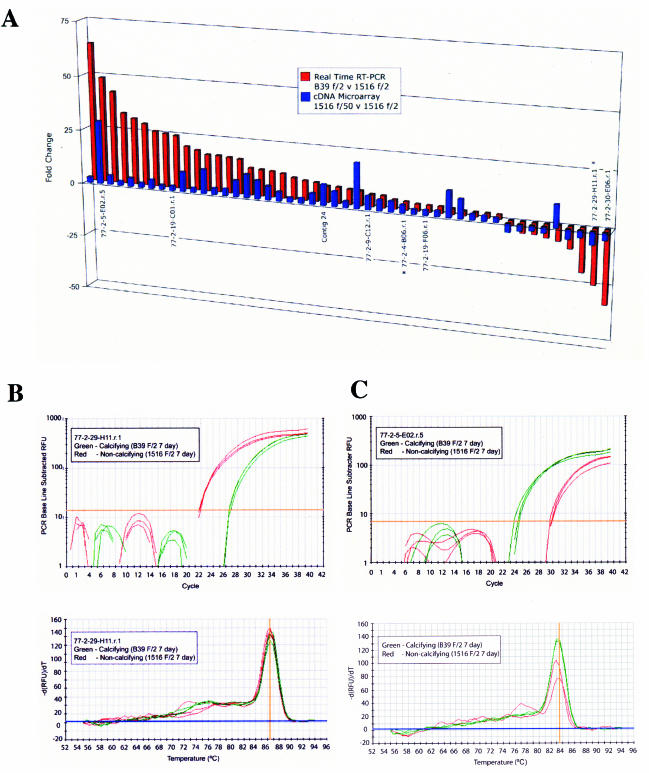
FIG. 5.
Real-time RT-PCR relative gene expression for 63 transcripts significantly up- or down-regulated in calcifying B39 relative to noncalcifying E. huxleyi 1516 cultures grown in phosphate-replete media (red bars). The corresponding cDNA microarray FC data are included for comparison (blue bars). Shown are real-time RT-PCR amplification plots (A) and corresponding melt curves of candidate biomineralization transcripts showing the differential expression of transcripts that are highly down-regulated, 77-2-29-H11 (B), and highly up-regulated, 77-2-5-E02 (C), in calcifying cells. RFU, relative fluorescence units.

