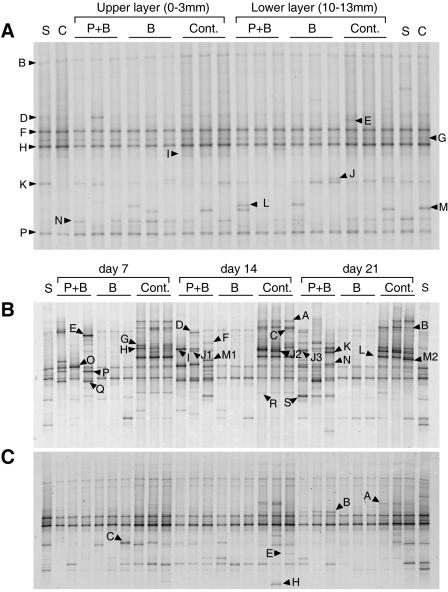
FIG. 6.
DGGE banding patterns of 18S rRNA gene partial sequences. (A) Comparison of all treatments and layers at day 0. (B and C) Comparison of days 7 to 21 for the upper layer (0 to 3 mm) (B) and the lower layer (10 to 13 mm) (C). Three replicate microcosms were analyzed per day and treatment. P+B, sterilized soil inoculated with protists and bacteria; B, sterilized soil inoculated with bacteria; Cont., control; S, γ-irradiation-sterilized soil; C, intact soil before sterilization. Bands with different mobilities are indicated by different designations. For the phylogenetic affiliation see Table 2. Note that the same designation may indicate different bands in the different gels. Only bands that appeared after day 0 are indicated in panels B and C.

