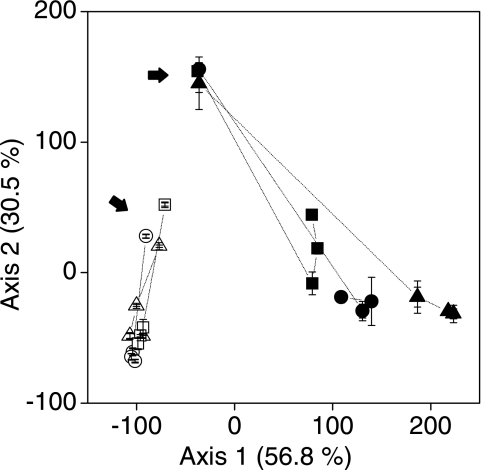
FIG. 7.
Correspondence analysis of bacterial communities based on T-RFLP patterns. Circles, sterilized soil inoculated with protists and bacteria (treatment P+B); triangles, sterilized soil inoculated with bacteria (treatment B); squares, control. Solid symbols, upper layer; open symbols, lower layer. Day 0 is indicated by arrows, and data from the same treatments are connected with lines in the order of time series. The values are means ± standard errors (n = 3).

