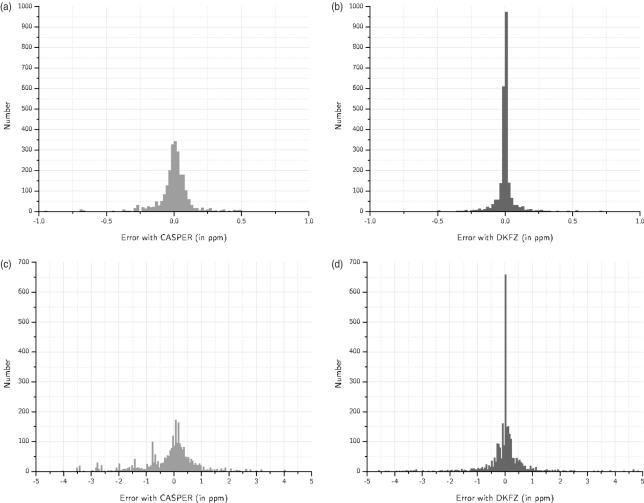
Figure 2.
(a) CASPER, histogram of the deviations between estimated and experimental 1H shifts. (b) GlyNest, histogram of the deviations between estimated and experimental 1H shifts. (c) CASPER, histogram of the deviations between estimated and experimental 13C shifts. (d) GlyNest, histogram of the deviations between estimated and experimental 13C shifts.

