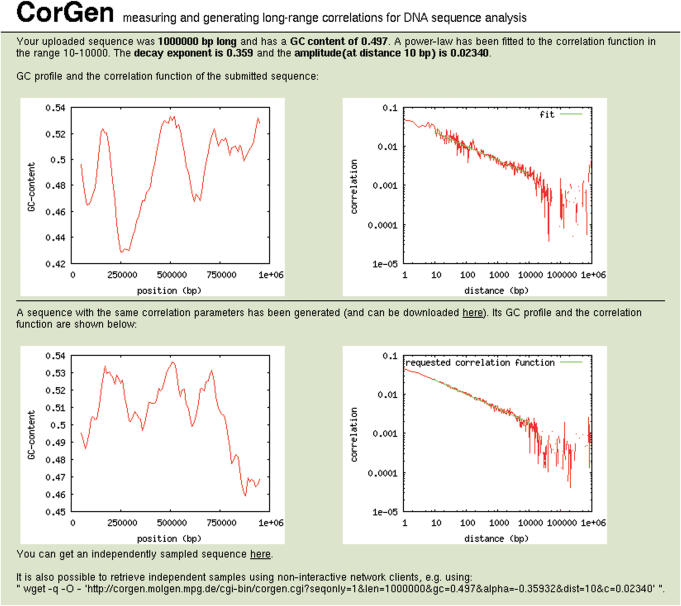
Figure 1.
CorGen analysis of a 1 Mb region on human chromosome 22. The two plots in the top part show the measured GC-profile (left) and correlation function (right) of the chromosomal region. In the double-logarithmic correlation graph, power-law correlations C(r) ∝ r−α show up as a straight line with slope α. The fitting has been performed in the range 10 < r <10 000, and the obtained parameters are α = 0.359 and C (10) = 0.0234 (green line). A corresponding random sequence of length 1 Mb with the measured long-range correlation parameters and average GC-content of the query sequence has been generated and can be downloaded by the user. Its composition profile and correlation function are shown in the two plots at the bottom.

