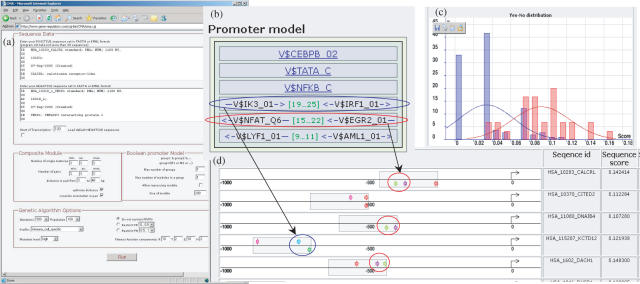
Figure 2.
CMA web interface and results of identification of the CM discriminating promoters of up-regulated genes from promoters of down-regulated genes upon TNF-alpha stimulation of primary human endothelial cells. (a) CMA web interface; (b) representation of the identified CM that consists of three single weight matrices and three pairs of matrices. The distance limits orientation of the sites in the pairs are schematically shown. (c) Two histograms of the fuzzy promoter score (fps) in the promoters of up-regulated genes (red) and in down-regulated genes (blue); (d) representation of TF sites found in the windows that correspond to the maximal score of the match of the CM in the promoters. Marked are identified NF-AT/EGR2 site pairs (red) and IK3/IRF1 site pairs (blue).

