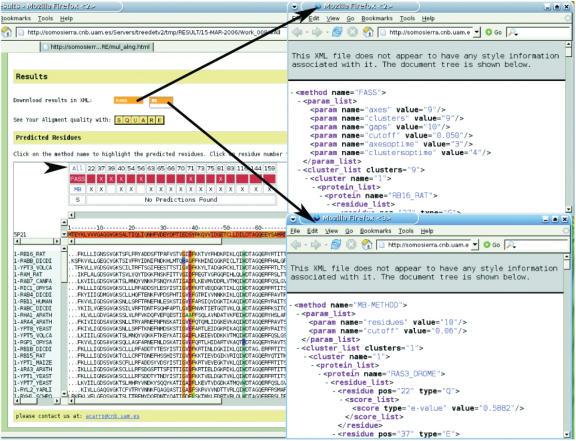
Figure 1.
TreeDet results page. This section provides a table with predicted positions associated to an input alignment. By clicking on the numbered positions the alignment moves towards these positions. The sequences in the alignment are re-ordered according either FASS or S-method and the resulting sequence clusters are highlighted in various shades of cyan. The scroll bar above the alignment includes the query sequence. The residues are highlighted by the optimal score from SQUARE, and indication of the conservation of each position within the broader sequence family. The predicted positions are highlighted according to Taylor's schema (19). For instance, the position 37 predicted by FASS and MB is critical for functional specificity (11). Additional XML files are provided to easy automated processing of the files. If a method does not provide results it is also indicated.

