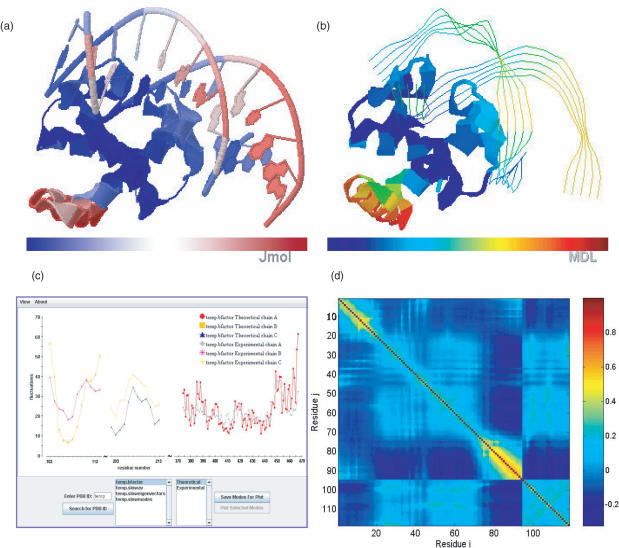
Figure 1.
Visualization of oGNM dynamics results for protein–DNA complex (PDB file: 1j1v). (a) Color-coded ribbon diagram illustrating the mobilities in the lowest frequency GNM mode using Jmol. The structure is colored from blue, white, to red in the order of increasing mobility. (b) Chime representation of the lowest mode for 1J1V; the structure is now colored from blue, green orange, to red. (c) Comparison of experimental and theoretical Bi factors with each chain shown as a different curve. In this example the correlation coefficient between computed and experimental data are 0.642. (d) Cross-correlation map, Cij, between residue fluctuations, plotted as a function of residue indices i (abscissa) and j (ordinate). The pairs subject to fully correlated motions (Cij = +1) are colored dark red; those undergoing anti-correlated motions (i.e. Cij < 0) are colored blue, and moderately correlated and uncorrelated (Cij ≈ 0) regions are yellow and cyan, respectively. Note that the residue numbers in (d) refer to the index of EN nodes, 1–94 for the protein and 95–118 for the DNA double strands. The mapping of these indices to PDB file residue numbers can be found in the output files delivered by oGNM.

