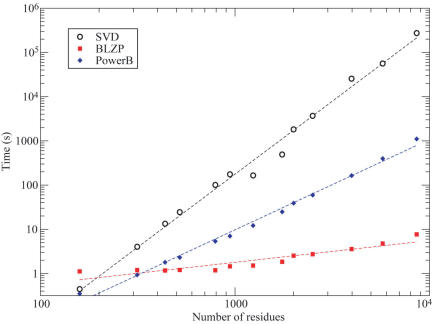
Figure 2.
Relationship between computational time and structure size for different algorithms used in the GNM analysis. The computational times (seconds) are plotted on a log-log scale against the number N of residues for 13 test proteins. The amount of time required to calculate all the GNM modes and theoretical B-factors (BGNM) by the standard SVD approach (black circles) scales as tSVD = 2.2 × 10⁻⁸ N3.30. The PowerB calculation (blue diamonds) scales as tPower = 7.2 × 10⁻⁶ N2.04. The computation of the 101 slowest modes using BLZPACK (red squares) exhibits a power law of tBLZP = 5.9 × 10⁻² N0.49. Using the latter two methods sequentially results in a dramatic decrease in computing time without loss of accuracy. The improvement is especially significant for large structures (N > 2000), permitting us to release on-line results in oGNM.

