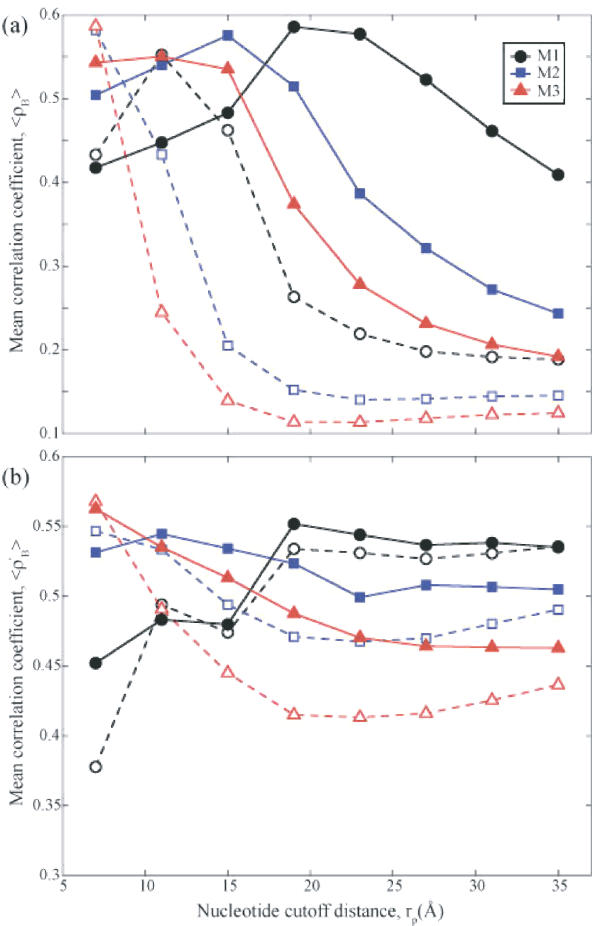
Figure 3.
Correlation coefficient between experiments and theory for GNMs with different EN nucleotide representations. Results from 3 nt models are shown: M1 (circles) has one-node-per-nucleotide, M2 (squares) has two-nodes-per-nucleotide and M3 (triangles) has three-nodes-per-nucleotide. (a) The average correlation coefficient <ρB> of all nodes between Biexp and BiGNM for a representative set of 64 structures (pure oligonucleotides or oligonucleotide–protein complexes; see Supplementary Table 2) as a function of nucleotide cutoff distance, rp. In these figures the dashed lines and hollow symbols use rc = 7.3 Å for the amino acid contact cutoff distance while the solid lines and filled symbols use rc = 15 Å. For all curves the cutoff distance for contacts between nucleotides and amino acids is (rp + rc)/2. For small values of rp (less than 7 Å) many structures have multiple zero eigenvalues implying multiple disjoint regions of the protein and are thus non-physical models for these structures. (b) The average correlation coefficient 〈ρ′B〉 between Biexp and BiGNM for the nucleotide nodes alone, within the same set of 64 structures as a function of rp. M3 yields the optimal correlations in both cases at rp = 7 Å, matching the value for the amino acid cutoff distance.

