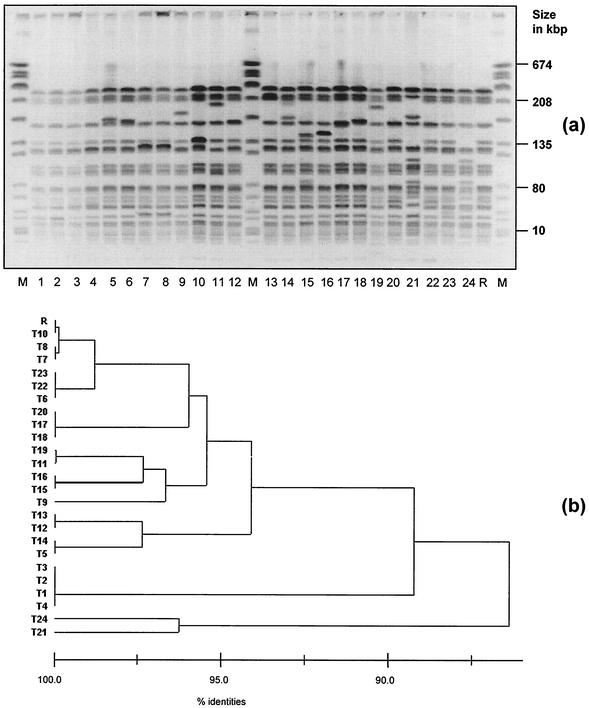
FIG. 1.
(a) Macrorestriction patterns of SmaI-digested genomic DNA of 24 transconjugants and recipient R (negated gel image). Lanes: M, SmaI-digested genomic DNA of S. aureus NCTC 8325; 1 to 24, transconjugants 1 to 24; R, recipient isolate. (b) Cluster analysis according to the method of Claus et al. (8) by using a band-based similarity coefficient-generated matrix (Dice).

