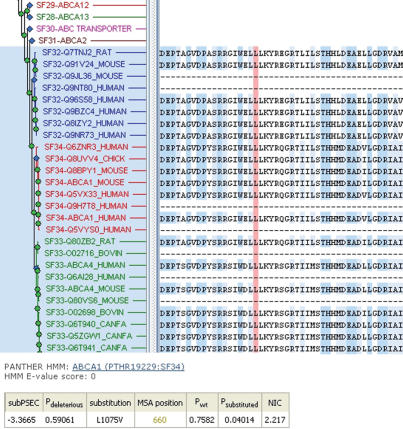
Figure 2.
Graphical view of the evolutionary data used to calculate coding SNP scores. The multiple sequence alignment of UniProt sequences (right) is displayed next to the protein family tree that shows the relationships between functionally distinct subfamilies. In this example, the uploaded sequence was for the product of the ABCA1 gene (RefSeq NP_005493), for the mutation L1075V. The column corresponding to the substituted amino acid is highlighted in red, and the subfamilies (ABCA1, ABCA4, ABCA7) used to calculate the score Pdeleterious are expanded in the tree view on the left. See text for more details. The user can expand and collapse tree nodes by clicking on any node (green circles or blue diamonds indicating subfamily nodes). Other subfamilies (e.g. ABCA2, ABCA12, ABCA13) are shown collapsed here.

