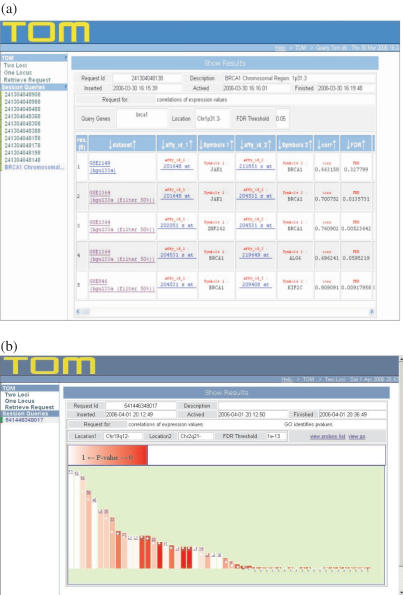
Figure 2.
(a) It shows an example of Results page for familial Breast Cancer, highlighting the known relationship between BRCA1 and JAK1. The Results table can scroll and more information, such as correlation values, then become visible. (b) It shows the graphical output of the functional analysis of Two Loci problem, namely Thyroid Cancer. This allows a rapid overview of the results. Every GO category of the candidate genes is represented in the bar graph. Categories are sorted based on the number of hits (height of the bar) and the P-value information is carried by a white to red shade of color. Tall white bars represent the best candidates, small red ones the worse.

