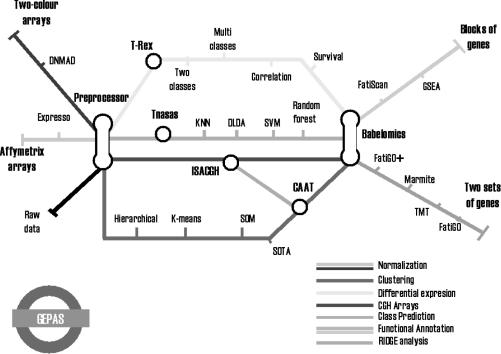
Figure 1.
Map of GEPAS functionalities as a subway line. Data (Affimetrix, two-colour or raw) are introduced from the left side and pass through the preprocessor. Then different types of analyses can be performed: gene selection (T-rex) in different situations (two or more classes, correlation or survival; see text for details) or class discovery (Tnasas) are two types of supervised analyses. Array-CGH data can be analysed through the red line ISACGH. Unsupervised analysis can also be performed using different methods. CAAT allows to map co-expressed genes on their chromosomal coordinates allowing the study of RIDGES (54). All the tools end up in Babelomics (11), that allows for two different types of analysis: comparison of two sets of genes of analysis or blocks of functionally related genes.

