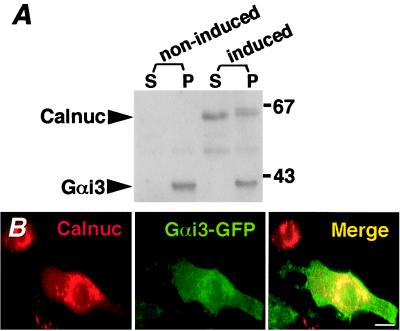
Figure 3.
Localization of Calnuc and Gαi3. (A) Expression of Gαi3 in non-induced and induced (10 μM ponasterone A for 48 h) EcR-CHO-Calnuc cells stably overexpressing calnuc. Cytosolic (100,000 × g supernatant) and membrane (100,000 × g pellet) fractions were prepared and immunoblotted with anti-calnuc IgG and affinity-purified anti-Gαi3 IgG (EC). The ratio of the cytosolic (S) and membrane-associated (P) pools of overexpressed calnuc is ≈60:40. The cytosolic pool shows a faster mobility than that of the membrane pool, which consists of two bands. Overexpression of calnuc does not significantly affect the level and distribution of endogenous Gαi3, which is found exclusively in the membrane fraction (P). However, the mobility of Gαi3 is reduced slightly. (B) Immunofluorescence. EcR-CHO-Calnuc cells were transiently transfected with Gαi3-GFP cDNA, followed by induction with 10 μM ponasterone A for 48 h. To maintain intracellular divalent ion concentration, cells were treated with 10 μM ionomycin/2 mM Ca2+/15 mM Mg2+, followed by fixation in 2% formaldehyde and incubation with anti-calnuc IgG and Texas Red-conjugated donkey anti-rabbit F(ab)′2. Overexpressed calnuc (Left) was detected in the Golgi region and in the cytoplasm. Gαi3-GFP (Middle) was found on the plasma membrane as well as in the Golgi region. The merged images (Right) indicate that the distribution of calnuc and Gαi3 partially overlap mainly in the Golgi region. (Bar = 10 μm.)

