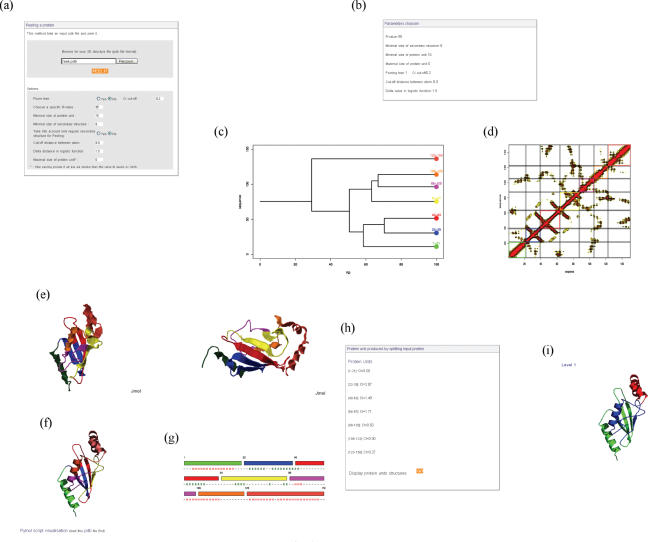
Figure 2.
PP2 web server. (a) PP2 interface. (b) Summary of the parameters used. (c) Tree showing the protein peeling process with the different final PUs and their positions. (d) Probability contact matrix with the cutting of the PUs. (e) JMol and (f) PyMol representation of the protein colored by PU. (g) Linear representation of the PUs with their secondary structure assignments. (h) Sequence positions of the PUs with their CI values. (i) Previous level of protein peeling represented using PyMol.

