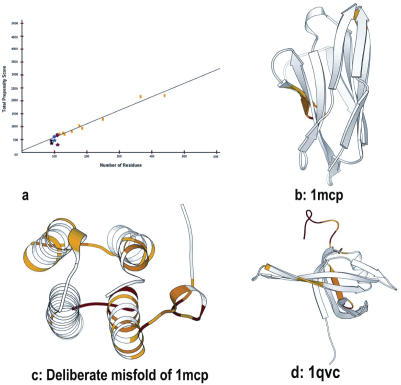
Figure 2.
Structure validation using HARMONY server. (a) Calibration plot applied on six proteins. Actual harmony propensity score plotted as a function of protein residue length. Points marked in yellow correspond to representative members of proteins in PDB of different lengths used for calibration (Supplementary material). Circle represents correct protein models (1mcp (•), 4fd1 (•), 1y4o (•)). Asterisk represents incorrect models (Deliberate misfold of 1mcp (*), 2fd1 (*), 1tgq (*)). Incorrect models attain low scores than correct models. (b) HARMONY substitution scores are mapped on the immunoglobulin structure (1mcp) in relation to the reverse sequence as a control. (c) Same as (b) but for the deliberate misfold of 1mcp. This model has larger regions of errors in comparison to the correct model (1mcp). (d) Comparison of HARMONY substitution scores of actual and reverse sequence mapped on the 3D structure of E.coli single-stranded DNA-binding protein (1qvc). Residues 52–53, 104–110 and 115–140 are marked with different colors (red, orange and yellow) depending upon the degree of local error.

