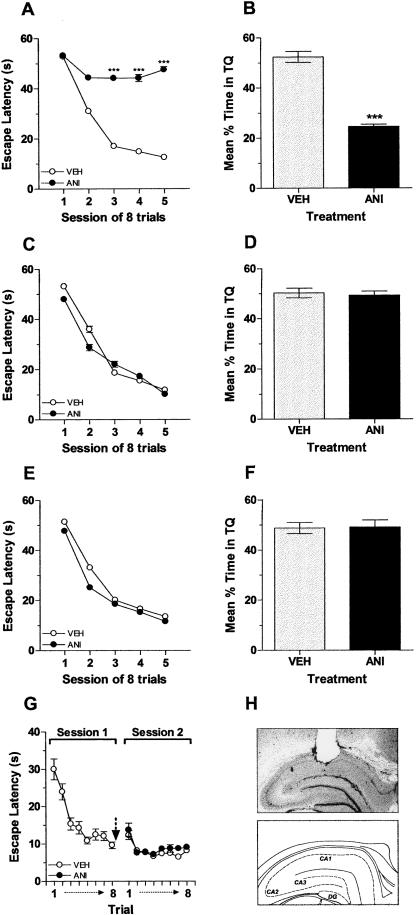
Figure 1.
Protein synthesis is required in the dorsal hippocampus during a restricted post-training time window for consolidation of spatial memory in the Morris water maze. (A) Mean escape latencies during the 5 d of acquisition of spatial learning of rats given anisomycin (160 μg/side; ANI, black circles) or vehicle (VEH, white circles) in the CA1 region of the dorsal hippocampus immediately after each session. Data are presented in blocks of eight trials as mean (±SEM). ***P < 0.001 vs. VEH in Bonferroni post hoc test after two-way ANOVA; n = 11 per group. (B) Mean time spent in the target quadrant (TQ) during a 60-sec probe test carried out 24 h after the fifth training day for rats that received anisomycin (160 μg/side; ANI, black bar) or vehicle (VEH, white bar) in the CA1 region of the hippocampus as in A. Data are presented as mean (±SEM). ***P < 0.001 vs. VEH in two-tailed Student’s t-test; n = 11 per group. (C) Animals were trained as in A but received anisomycin (160 μg/side; ANI, black circles) or vehicle (VEH, white circles) 3 h after the last trial of each one of the five training sessions. Data are presented in blocks of eight trials as mean (±SEM). F(1,14) = 0.68; P > 0.1 for treatment in two-way ANOVA; n = 8 per group. (D) Mean time spent in the target quadrant (TQ) during a 60-sec probe test carried out 24 h after the fifth training day for rats that received anisomycin (160 μg/side; ANI, black bar) or vehicle (VEH, white bar) in the CA1 region of the hippocampus as in C. Data are presented as mean (±SEM). t(14) = 0.38; P > 0.1 in two-tailed Student’s t-test; n = 8 per group. (E) Animals were trained as in A but received anisomycin (160 μg/side; ANI, black circles) or vehicle (VEH, white circles) 6 h after each training session. Data are presented in blocks of eight trials as mean (±SEM). F(1,14) = 3.87; P > 0.1 for treatment in two-way ANOVA; n = 8 per group. (F) Mean time spent in the target quadrant (TQ) during a 60-sec probe test carried out 24 h after the fifth training session for rats that received anisomycin (160 μg/side; ANI, black bar) or vehicle (VEH, white bar) in the CA1 region of the hippocampus as in E. Data are presented as mean (±SEM). t(14) = 0.10; P > 0.1 in two-tailed Student’s t-test; n = 8 per group. (G) Mean escape latencies during two training sessions in the nonspatial version of the Morris water maze of rats given anisomycin (160 μg/side; ANI, black circles) or vehicle (VEH, gray circles) in the CA1 region of the dorsal hippocampus. The arrow indicates the moment of infusion. Data are presented as mean (±SEM); F(1,14) = 0.69; P > 0.1 during Session 2 in two-way ANOVA; n = 8 per group. (H) representative photomicrograph (top) and schematic drawing used with permission from Elsevier © 1986, from the atlas of Paxinos and Watson (1986) (bottom) showing the infusion site in dorsal CA1.

