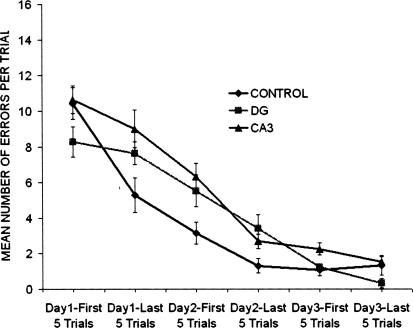
Figure 2.
Mean number of errors per trial were grouped in five-trial blocks across a total of 3 d of acquisition in the Hebb-Williams maze for the control, CA3, and dentate gyrus (DG) groups. The CA3 lesions group made more errors than DG or control groups as determined by a Tukey HSD paired comparison (P < 0.05).

