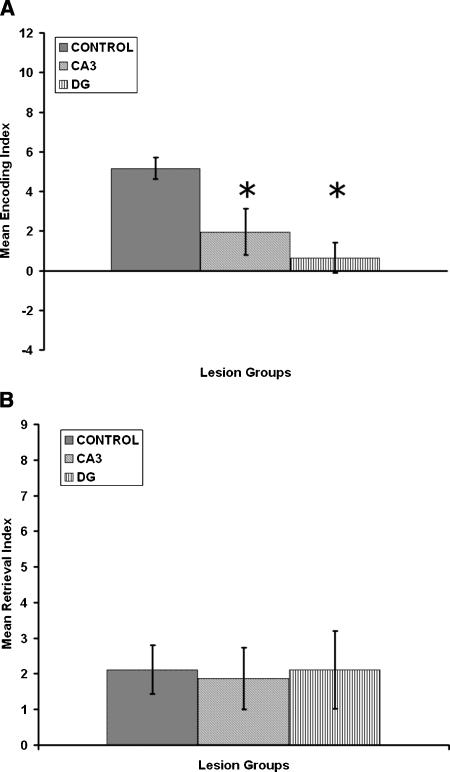
Figure 3.
(A) Mean encoding index in the Hebb-Williams maze for the control, CA3, and dentate gyrus (DG) groups. (B) Mean retrieval index in the Hebb-Williams maze for the control, CA3, and dentate gyrus (DG) groups. The results show that CA3 and DG groups disrupt encoding but have no deleterious effects on retrieval. Asterisks (*) correspond to significant differences from controls (P < 0.01) as determined by Tukey HSD paired-comparison test.

