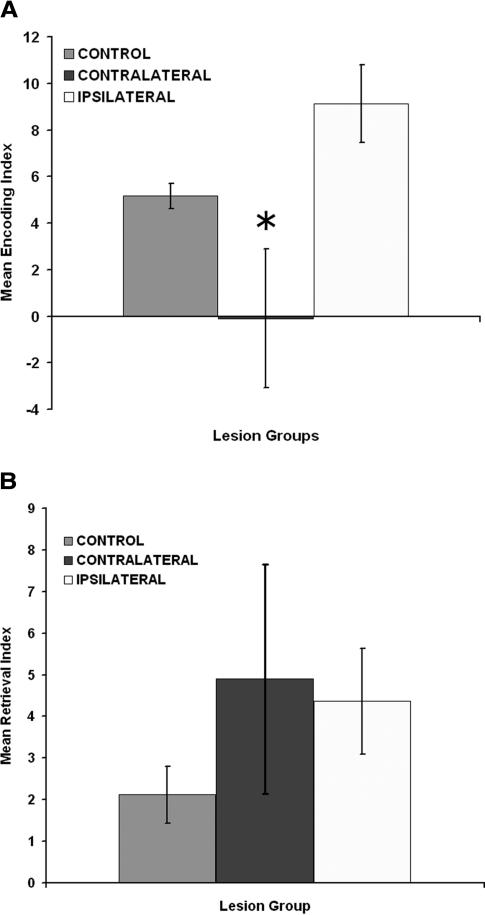
Figure 5.
(A) Mean encoding index in the Hebb-Williams maze for the control, contralateral, and ipsilateral lesions groups. (B) Mean retrieval index in the Hebb-Williams maze for the control, contralateral, and ipsilateral lesions groups. Asterisks (*) correspond to significant differences from controls (P < 0.01) as determined by the Tukey HSD paired-comparison test.

