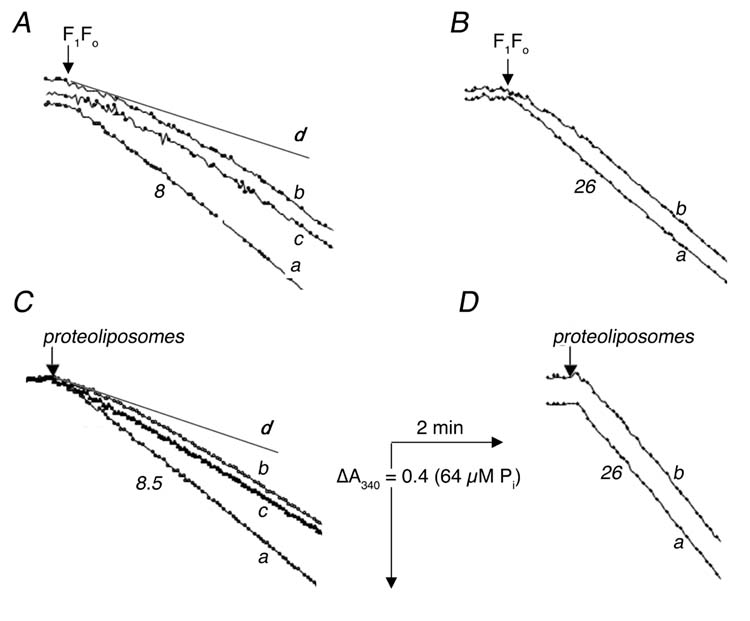
Fig. 1.

Time-course of ATP hydrolysis by isolated F1Fo (A, B) and by F1Fo incorporated into proteoliposomes (C, D) at 15° C (A, C) and at 37° C (B, D). ATPase activity was measured with an ATP regenerating system as described in “Experimental Procedures”. The reactions were initiated by addition of 2.5 μg (A), 0.7 μg (B), 1.2 μg (C) or 0.4 μg (D) of protein. In all panels trace a represents “hot” enzyme, in which the sample was taken from ice and pre-incubated at room temperature for 5 min before measurement. All traces b represent “cold” enzyme, in which the sample was taken directly from ice for measurement In panels (A) and (C) trace c represents enzyme that was taken from ice, then incubated at room temperature for 5 min, and returned to ice for 5 min, before measurement, and the lines marked d represent the initial rates of “cold” enzyme (trace b). Numbers shown near the curves indicate the rates of ATP hydrolysis expressed in μmol ATP per min per mg of protein.
