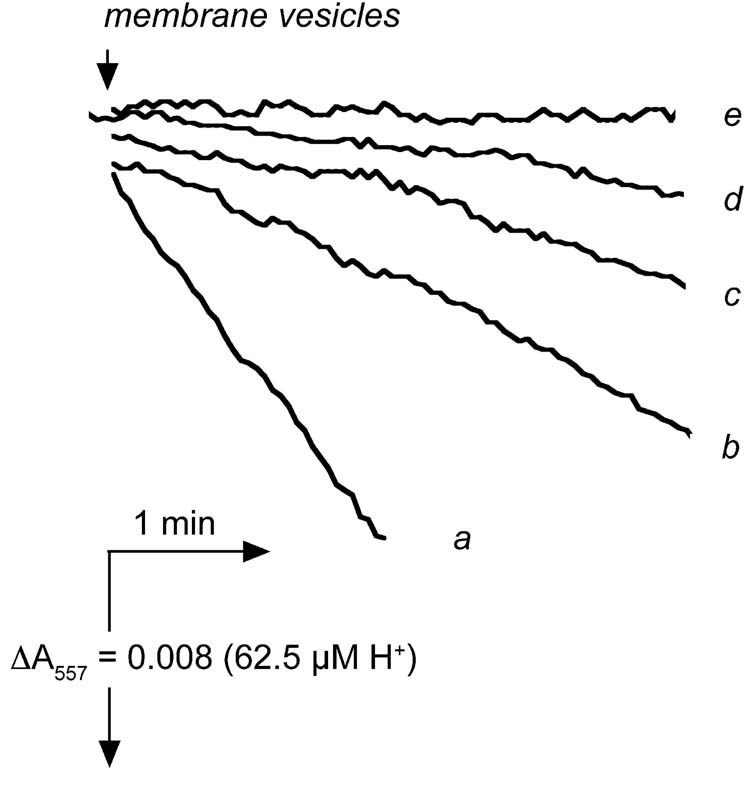
Fig. 4.

Time courses of ATP hydrolysis by membrane vesicles pre-incubated with azide. Rates of ATP hydrolysis were measured using the phenol red assay system at 10° C in the presence of 4 mM Mg2+. Trace a shows the rate of control membrane vesicles using 10 mM ATP. Traces b-e are from azide-treated membranes (N-particles). Trace b shows the rate of ATP hydrolysis by N-particle in the presence of 10 mM ATP. Trace c is the same as trace b, except that the medium contains 10 mM Pi. Trace d shows the rate of ATP hydrolysis by N-particles using 2 mM ATP, and trace e shows the rate with 0.5 mM ATP. All samples were kept at room temperature prior to the assay. The traces shown were typical ones from at least three sets of measurements.
