
Figure 1.
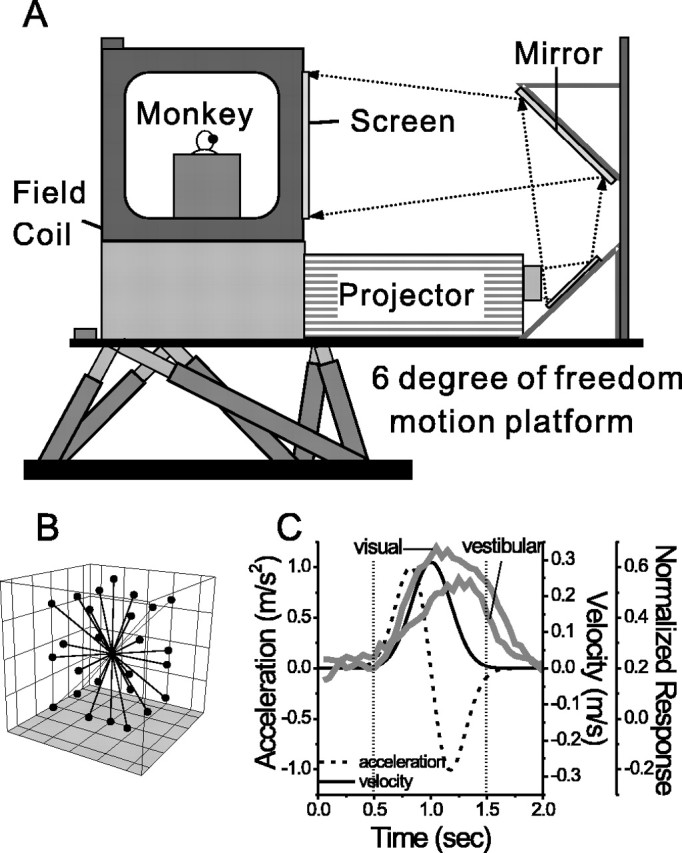
Experimental setup and heading stimuli. A, Schematic illustration of the virtualreality apparatus. The monkey, eye-movement monitoring system (field coil), and projector sit on top of a motion platform with six degrees of freedom. B, Illustration of the 26 movement vectors used to measure 3D heading tuning curves. C, Normalized population responses to visual and vestibular stimuli (gray curves) are superimposed on the stimulus velocity and acceleration profiles (solid and dashed black lines). The dotted vertical lines illustrate the 1 s analysis interval used to calculate mean firing rates.