
Figure 10.
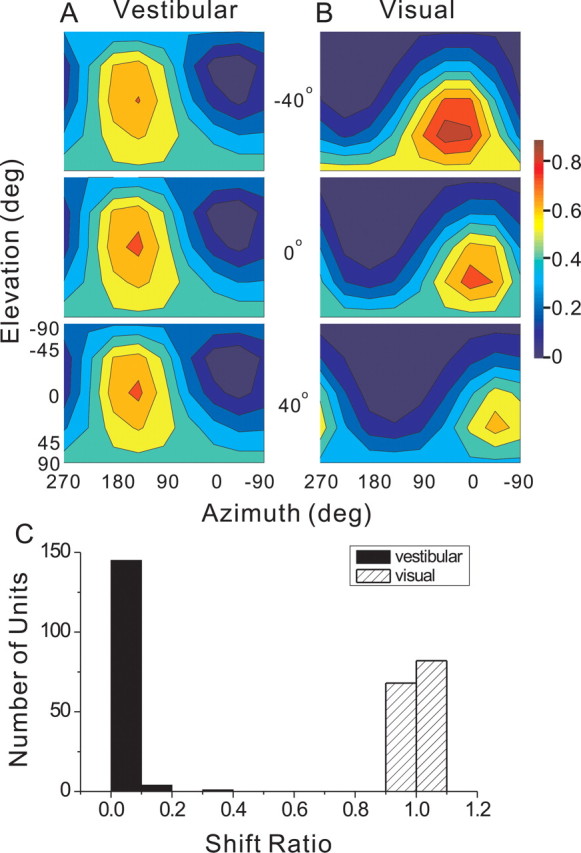
A, B, Example of 3D heading tuning functions for a network hidden unit tested at three horizontal eye positions (from top to bottom, 40° left, 0°, and 40° right) under the vestibular (A) and visual (B) conditions. The format is similar to Figure 2. C, Shift ratio distributions for all 150 hidden units under the two single-cue conditions.