
Figure 5.
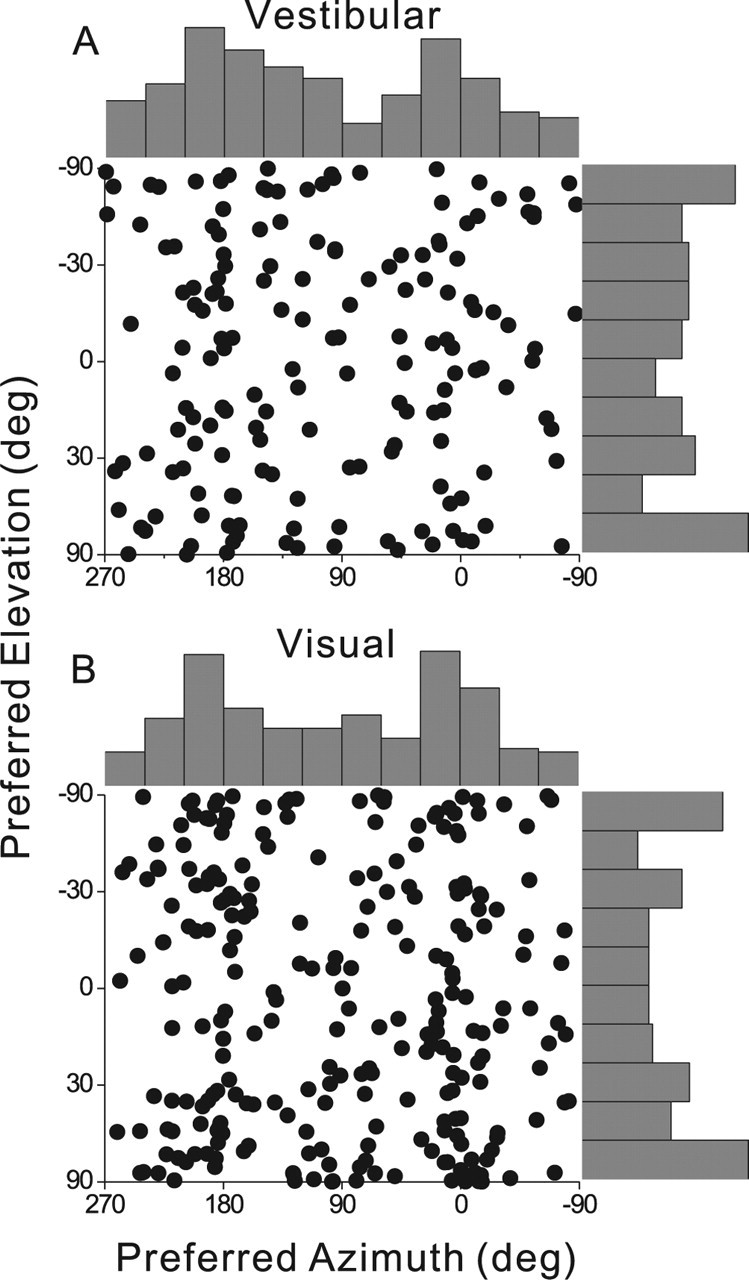
Distributions of 3D heading preferences of MSTd neurons for the vestibular condition (A) and the visual condition (B). Each data point in the scatter plot corresponds to the preferred azimuth (abscissa) and elevation (ordinate) of a single neuron with significant heading tuning (A, n = 162; B, n = 251). The data are plotted on Cartesian axes that represent the Lambert cylindrical equal-area projection of the spherical stimulus space. Histograms along the top and right sides of each scatter plot show the marginal distributions.