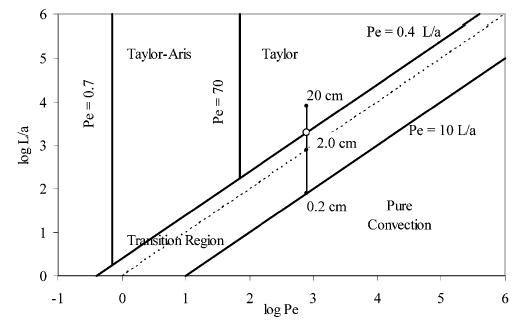
Figure 3.

Diagrammatic representation of the different solution dispersion regimes. The line indicates the position for Cu(II) –GGFL traveling in a 50-μm-i.d. tube at a flowrate of 1.8 μL/min at tubing lengths of 0.2, 2, and 20 cm, respectively. Adapted with permission from Figure 4.6.522 (copyright 1994 of John Wiley & Sons, Inc.).
