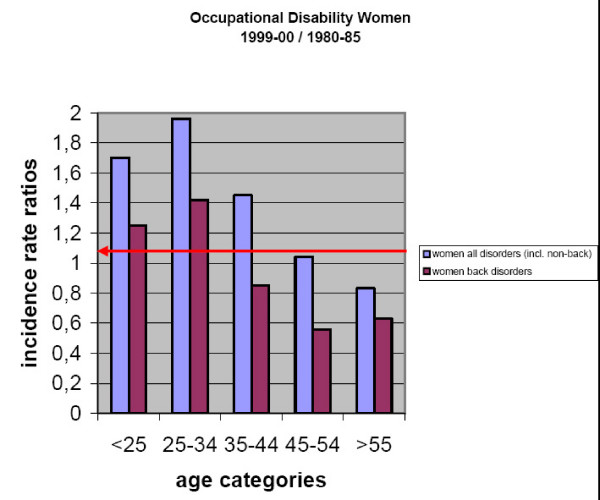
Figure 1.

Incidence rate ratios of occupational disability among women due to all back disorders and incidence rate ratios of occupational disability due to any disorder (incl. non-back disorders) for 1999–2000 compared to 1980–1985. Arrow at the rate ratio of 1 indicates no difference between the two time periods.
