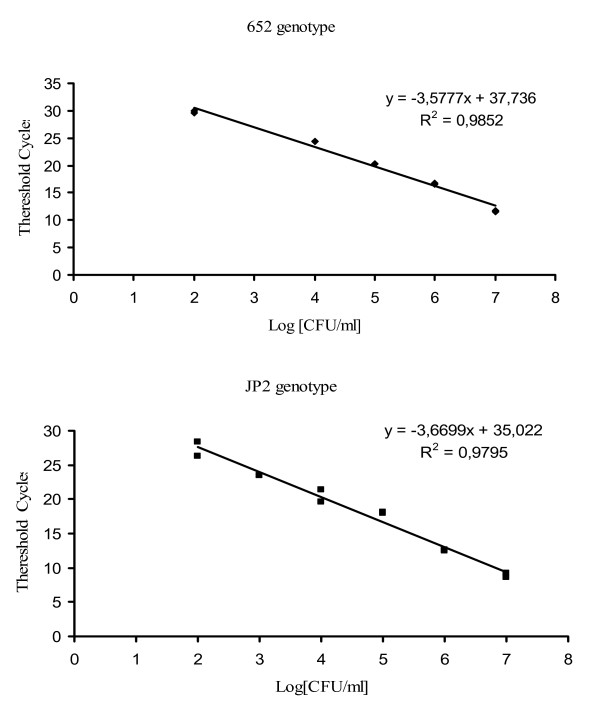
Figure 4.
Quantitative standard curves. Linear regressions obtained by real time PCR using a LightCycler instrument with SYBR Green I protocol of serially diluted suspensions for JP2 or 652 Actinobacillus actinomycetemcomitans genotypes (107-102 cells/ml). Threshold cycle (CT) value is directly related to the amount of PCR product and therefore related to the initial amount of target DNA present in the PCR reaction. CT (threshold cycle) represent the fractional PCR cycle number at which the fluorescence signal exceeds background fluorescence [40].

