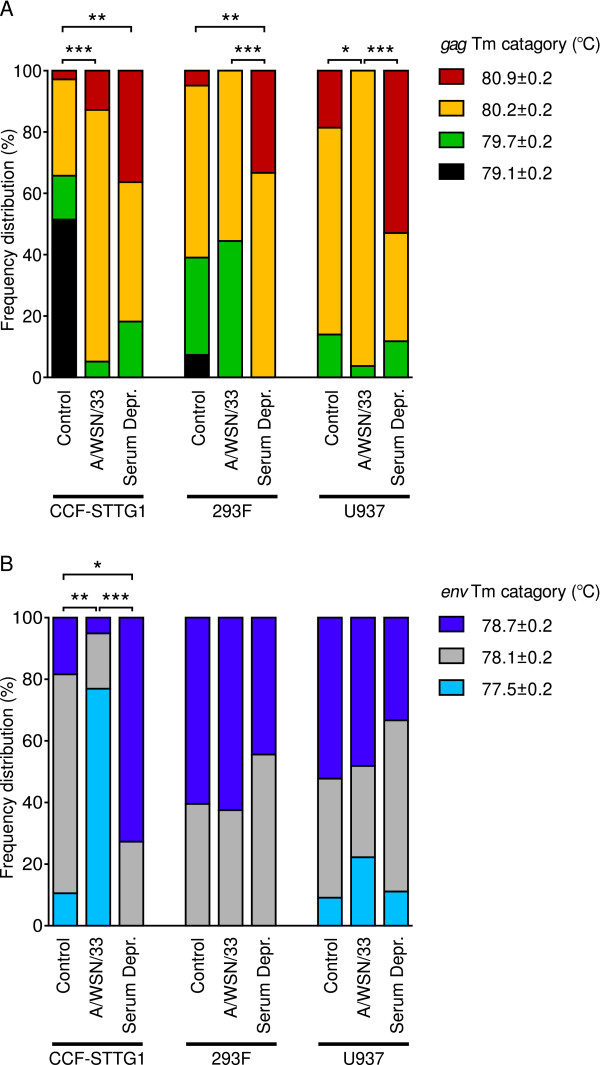
Figure 3.
Influence of influenza A/WSN/33 virus infection and serum deprivation on the detectable frequency distribution of transcribed HERV-W related sequences in CCF-STTG1, 293F and U937 cells. (A) Distribution of detected HERV-W gag amplicons into four melting temperature ranges observed in control cells (n = 38-44), influenza A/WSN/33 infected cells (n = 24-39) and serum deprived cells (n = 11-18). (B) Distribution of detected HERV-W env amplicons into three melting temperature ranges observed. Statistical significance is indicated by * = p < 0.05, ** = p < 0.01, *** = p < 0.001.

