
Figure 4.
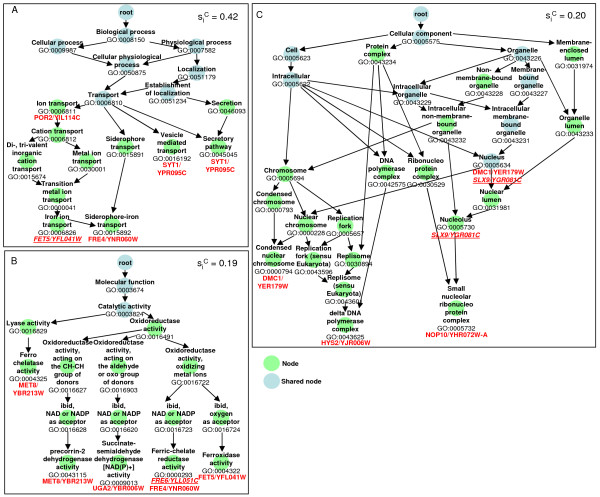
Induced GO graphs for one cluster from each GO aspect for the Schreiber data set. Induced GO graphs containing the BP, MF or CC annotation for the proteins found in Schreiber (A) BP cluster 2, (B) MF cluster 2, and (C) CC cluster 8, respectively. Nodes found in all of the individual induced GO graphs for the proteins in the cluster are shown in blue. The silhouette width for each cluster (siC) is shown in the upper right hand corner. The medoid protein for each cluster is italicized and underlined.